Create a Report module helps the user to create a new report for Form. When the user clicks on the Create report button in reports dashboard page the system redirects to the report designer page, where the user can design the report based on their requirements. In this report designer page, the user must provide the following details:
- Report Title and Description
- Select Report Element Type
In this segment, user has 4 elements to choose.
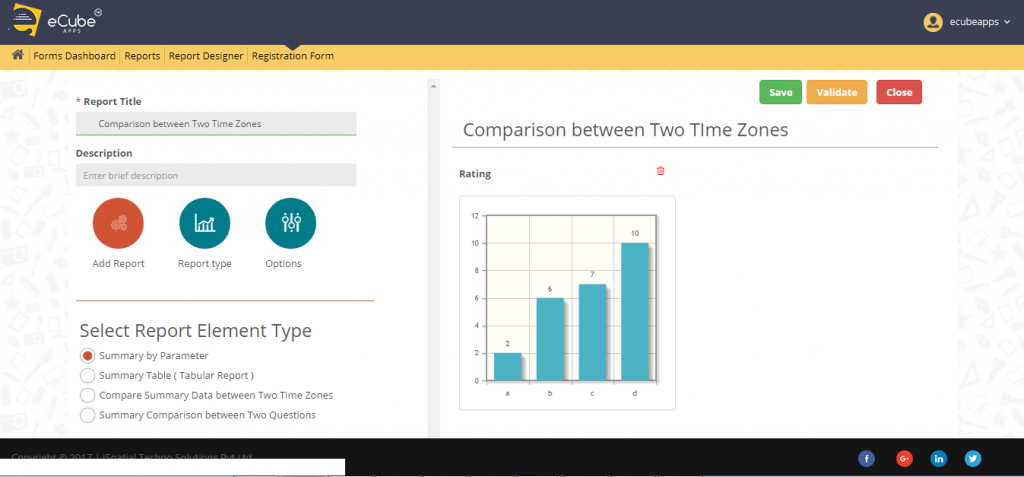
- Summary by parameter:
If the user chooses this element, he must click on the next button to select other options for select question/parameter and control type. Where in select question/parameter section he/she will get a dropdown to choose an appropriate question and in control type section user must choose one option from the pie chart, donut chart, bar chart, line chart, summary table and click on next button. The user can click on the prev button to check or change the previous options.

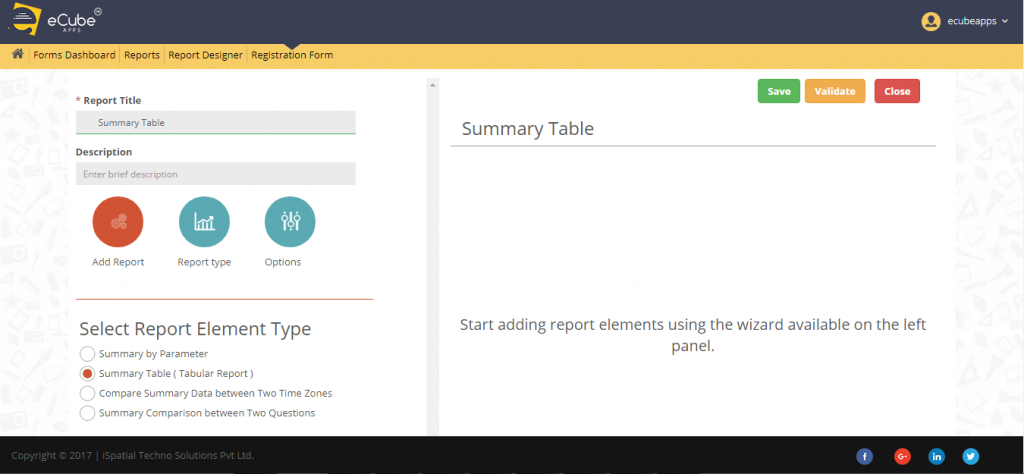
2. Summary table (tabular report):
If the user chooses this element and clicks on the next button the user must select the options from Form fields and system fields. Form fields are like textbox, phone etc. System fields are like IP address, browser name and country etc., and click on the next button. The user can click on the prev button to check or change the previous options.
3. Compare summary data between two time zones:
If the user chooses this element and clicks on the next button user must choose the options for select question/parameter, date range to compare and control type. In select question/parameter section he/she will get a dropdown to choose an appropriate question. In date range to compare section user must provide the dates of start range and end range and in control type section user must choose one option from the pie chart, donut chart, bar chart, line chart, summary table and click on next button. The user can click on the prev button to check or change the previous options.
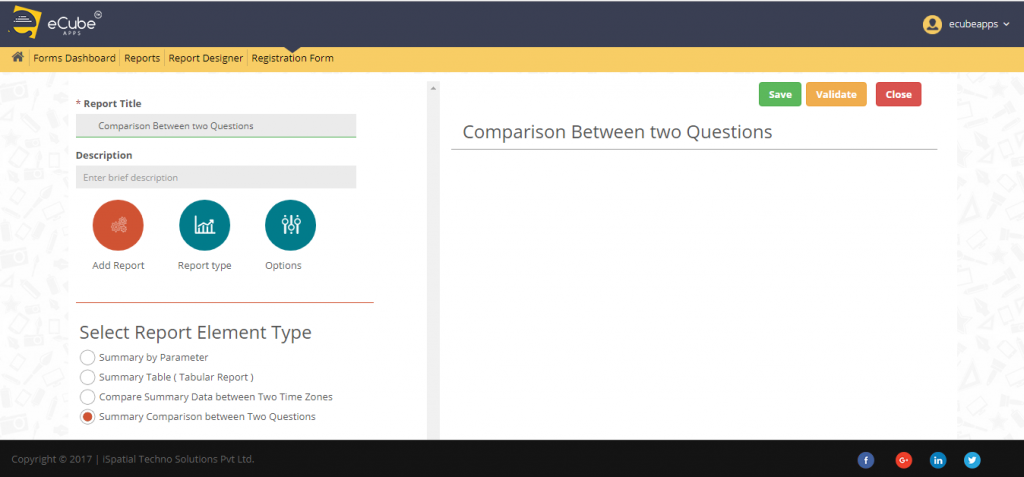
4. Summary comparison between two questions:
If the user chooses this element and click on the next button. The user must choose the options for select question/parameter, select question/parameter to compare and control type. Where in select question/parameter and select question/parameter to compare sections he/she will get a dropdown to choose an appropriate question. In date range to compare section user must provide the dates of start range and end range and in control type section user must choose one option from the pie chart, donut chart, bar chart, line chart, summary table and click on next button. The user can click on the prev button to check or change the previous options.
Display properties
After clicking on the next user must provide display properties like widget title and widget subtitle and click on add button to save the options. If the user wants to change the options, he/she can go with the previous button.
When the user clicks on the add button the report will be added to the report’s designer area. The user must click on the save button and he /she will get a message “Report created successfully”.
Leave A Comment?